Blog post activity over the last 3+ years
I have been running this blog now for a little over 3 and a half years, and after reading this post, i borrowed the idea of graphing my blog posting activity over that time. Well, here it is (click for a larger image)
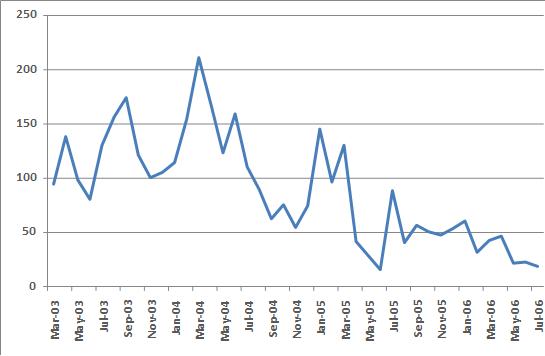
As you can see, when i started the blog, i was posting 100+ posts a month, which went to over 200+ a month in March 04, but since September 05, its been getting lower. Hopefully this will get better over time…
bk_keywords: Excel, blog
blog comments powered by Disqus